Evaluating Visual Grounding Models on Accounting Software
Jan 28, 2026
13 min read
Saumil Srivastava
Engineering Leader
Table Of Contents
Loading content outline...
Abstract
This blog evaluates visual grounding models on professional accounting software interfaces. Testing GroundNext-7B and ShowUI-2B across 595 grounding targets from four platforms (Odoo, QuickBooks Online, ERPNext, Dolibarr ), the results show a significant performance gap compared to published benchmark results.
GroundNext-7B achieves 13.28% accuracy on accounting UI compared to 50.2% on ScreenSpot-Pro—a 37 percentage point gap. ShowUI-2B achieves 0.15% accuracy on this benchmark. The 89-94% SOTA agreement rate indicates both models produce incorrect predictions on similar samples, suggesting ensemble strategies may have limited benefit.
Evaluating Visual Grounding Models on Accounting Software | Saumil Srivastava's Blog
Semantic aliasing (42.8%) emerges as the dominant failure mode, followed by icon scale (33.7%) and coordinate regression (23.4%). Platform variance is high: Odoo's modern OWL framework achieves 45.98% while ERPNext achieves only 3.70%, suggesting UI complexity significantly impacts grounding performance.
These findings suggest domain-specific fine-tuning may be beneficial for deploying visual grounding models in vertical enterprise applications.
1. Introduction
Visual grounding is the task of localizing UI elements from natural language descriptions, is foundational to Computer-Use Agents (CUAs). Recent models report impressive benchmark performance: ShowUI-2B achieves 7.7% on ScreenSpot-Pro, while GroundNext-7B (trained on 700K instruction pairs from the GroundCUA dataset) achieves 50.2% on the same benchmark [1].
This study validates this assumption on accounting software.
The evaluation covers SOTA grounding models on professional accounting software, a vertical enterprise domain characterized by dense information displays, small interactive elements, and repetitive form structures. The results show models achieving 50-75% on standard benchmarks achieve 0-13% on accounting interfaces.
Quantified domain gap of 37 percentage points(GroundNext-7B) between published and real-world accuracy
Failure taxonomy identifying semantic aliasing, icon scale, and coordinate regression as primary failure modes
Platform variance analysis revealing 42pp accuracy range (3.7%-46%) correlated with UI framework modernity
2. Related Work
2.1 Visual Grounding Models
GroundNext-7B [1] extends Qwen2.5-VL-7B with training on the GroundCUA dataset (700K instruction pairs from 56K desktop screenshots). It achieves 50.2% (SFT) / 52.9% (RL) on ScreenSpot-Pro.
ShowUI-2B [2] introduces UI-guided token selection for efficient grounding, achieving 7.7% on ScreenSpot-Pro with only 2B parameters (75.1% on original ScreenSpot)
UGround-V1-7B [3] trains on 10M UI elements from 1.3M screenshots, achieving 31.1% on ScreenSpot-Pro.
77 Odoo samples from `form_01`, `nav_01`, and `vendor_01` directories were excluded due to missing screenshots during evaluation. This affected Odoo's sample count (87 valid of 164 total) but did not impact QBO, ERPNext, or Dolibarr data.
4. Experimental Setup
4.1 Models Evaluated
GroundNext-7B (ServiceNow/GroundNext-7B-V0)
Architecture: Qwen2.5-VL-7B (8B parameters)
Output: Pixel coordinates via tool call JSON format
Published: 50.2% ScreenSpot-Pro (SFT)
ShowUI-2B (showlab/ShowUI-2B)
Architecture: Qwen2-VL-2B with UI-guided token selection
Output: Normalized coordinates [0, 1]
Published: 7.7% ScreenSpot-Pro
4.2 Evaluation Protocol
Metric: Point-in-box accuracy prediction is correct if (x, y) falls within ground truth bounding box.
The 89-94% agreement rate indicates models produce incorrect predictions on similar samples. This suggests ensemble strategies may have limited benefit when failure modes overlap.
5.5 Performance by Element Size
Size
Area Ratio
GroundNext-7B
ShowUI-2B
Large
>1%
**23.08%**
0%
Medium
0.1-1%
9.68%
0%
Small
<0.1%
8.93%
0%
Even large elements achieve only 23% accuracy—far below the 50%+ expected from benchmark performance.
5.6 Performance by Task Category
Category
GroundNext-7B
ShowUI-2B
Navigation
**23.08%**
0%
List Navigation
0%
0%
Data Entry
0%
0%
List navigation and data entry—core accounting workflows—show 0% accuracy across both models.
6. Failure Analysis
6.0 Visual Examples of Failure Cases
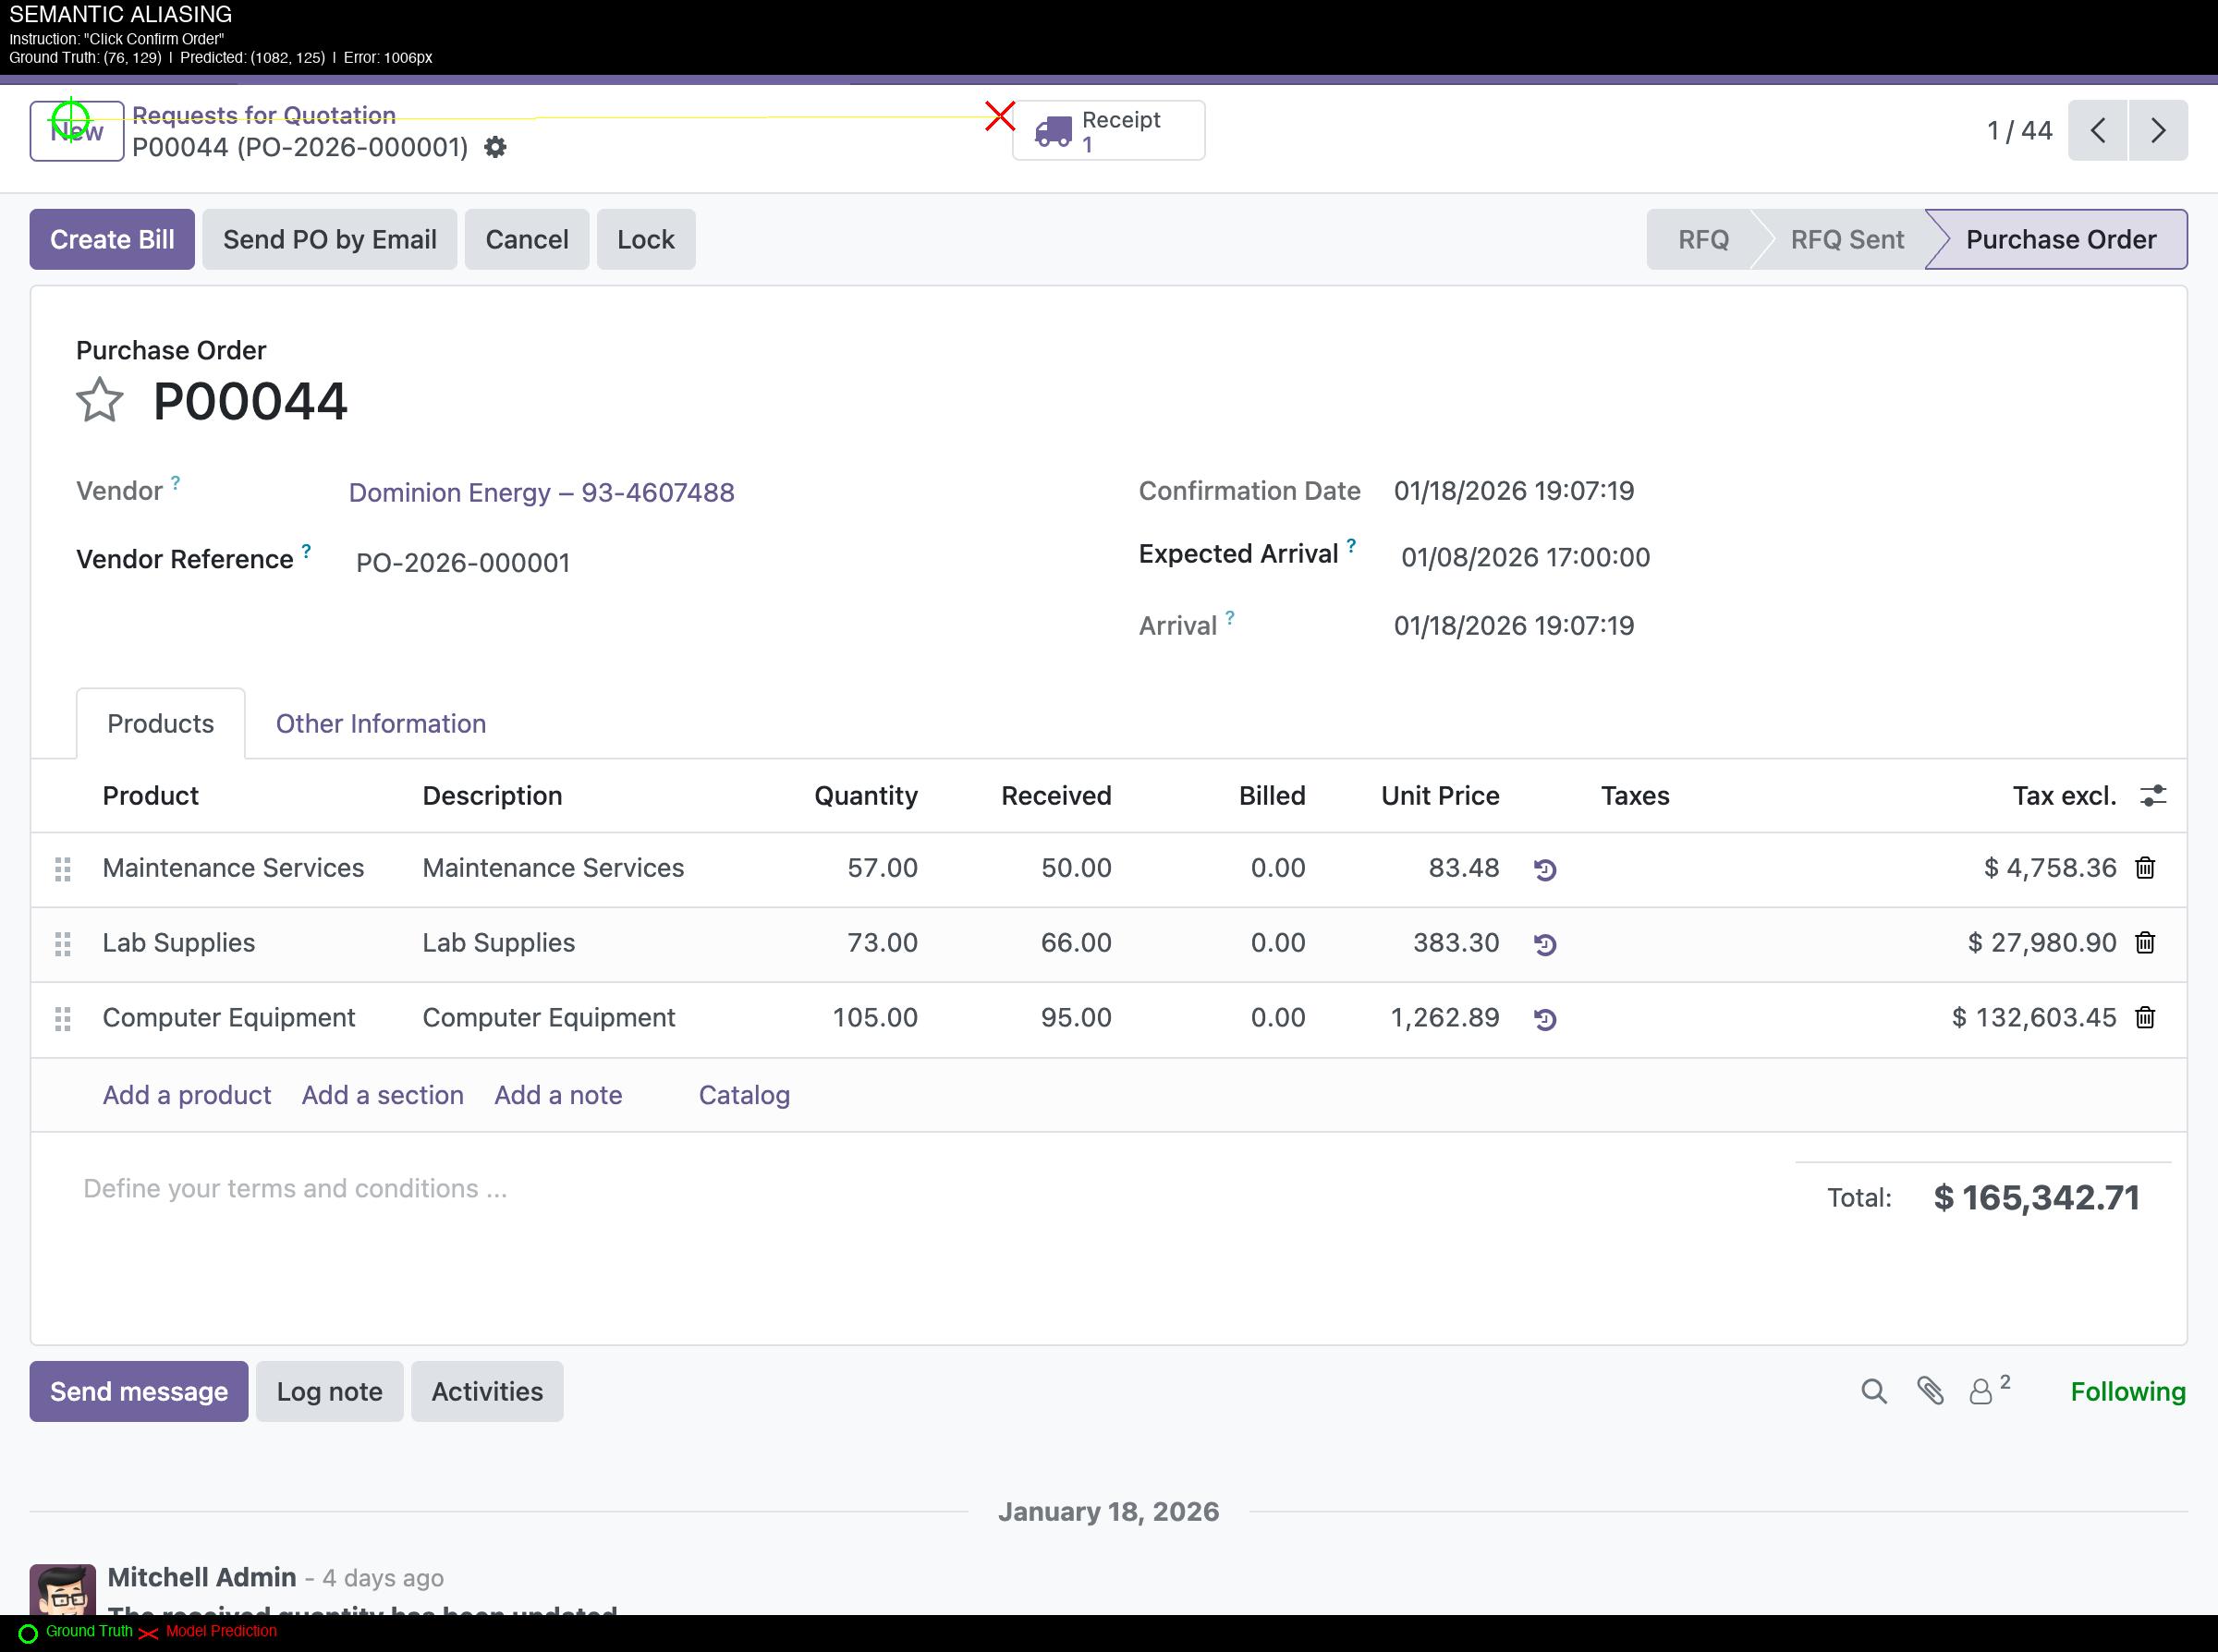
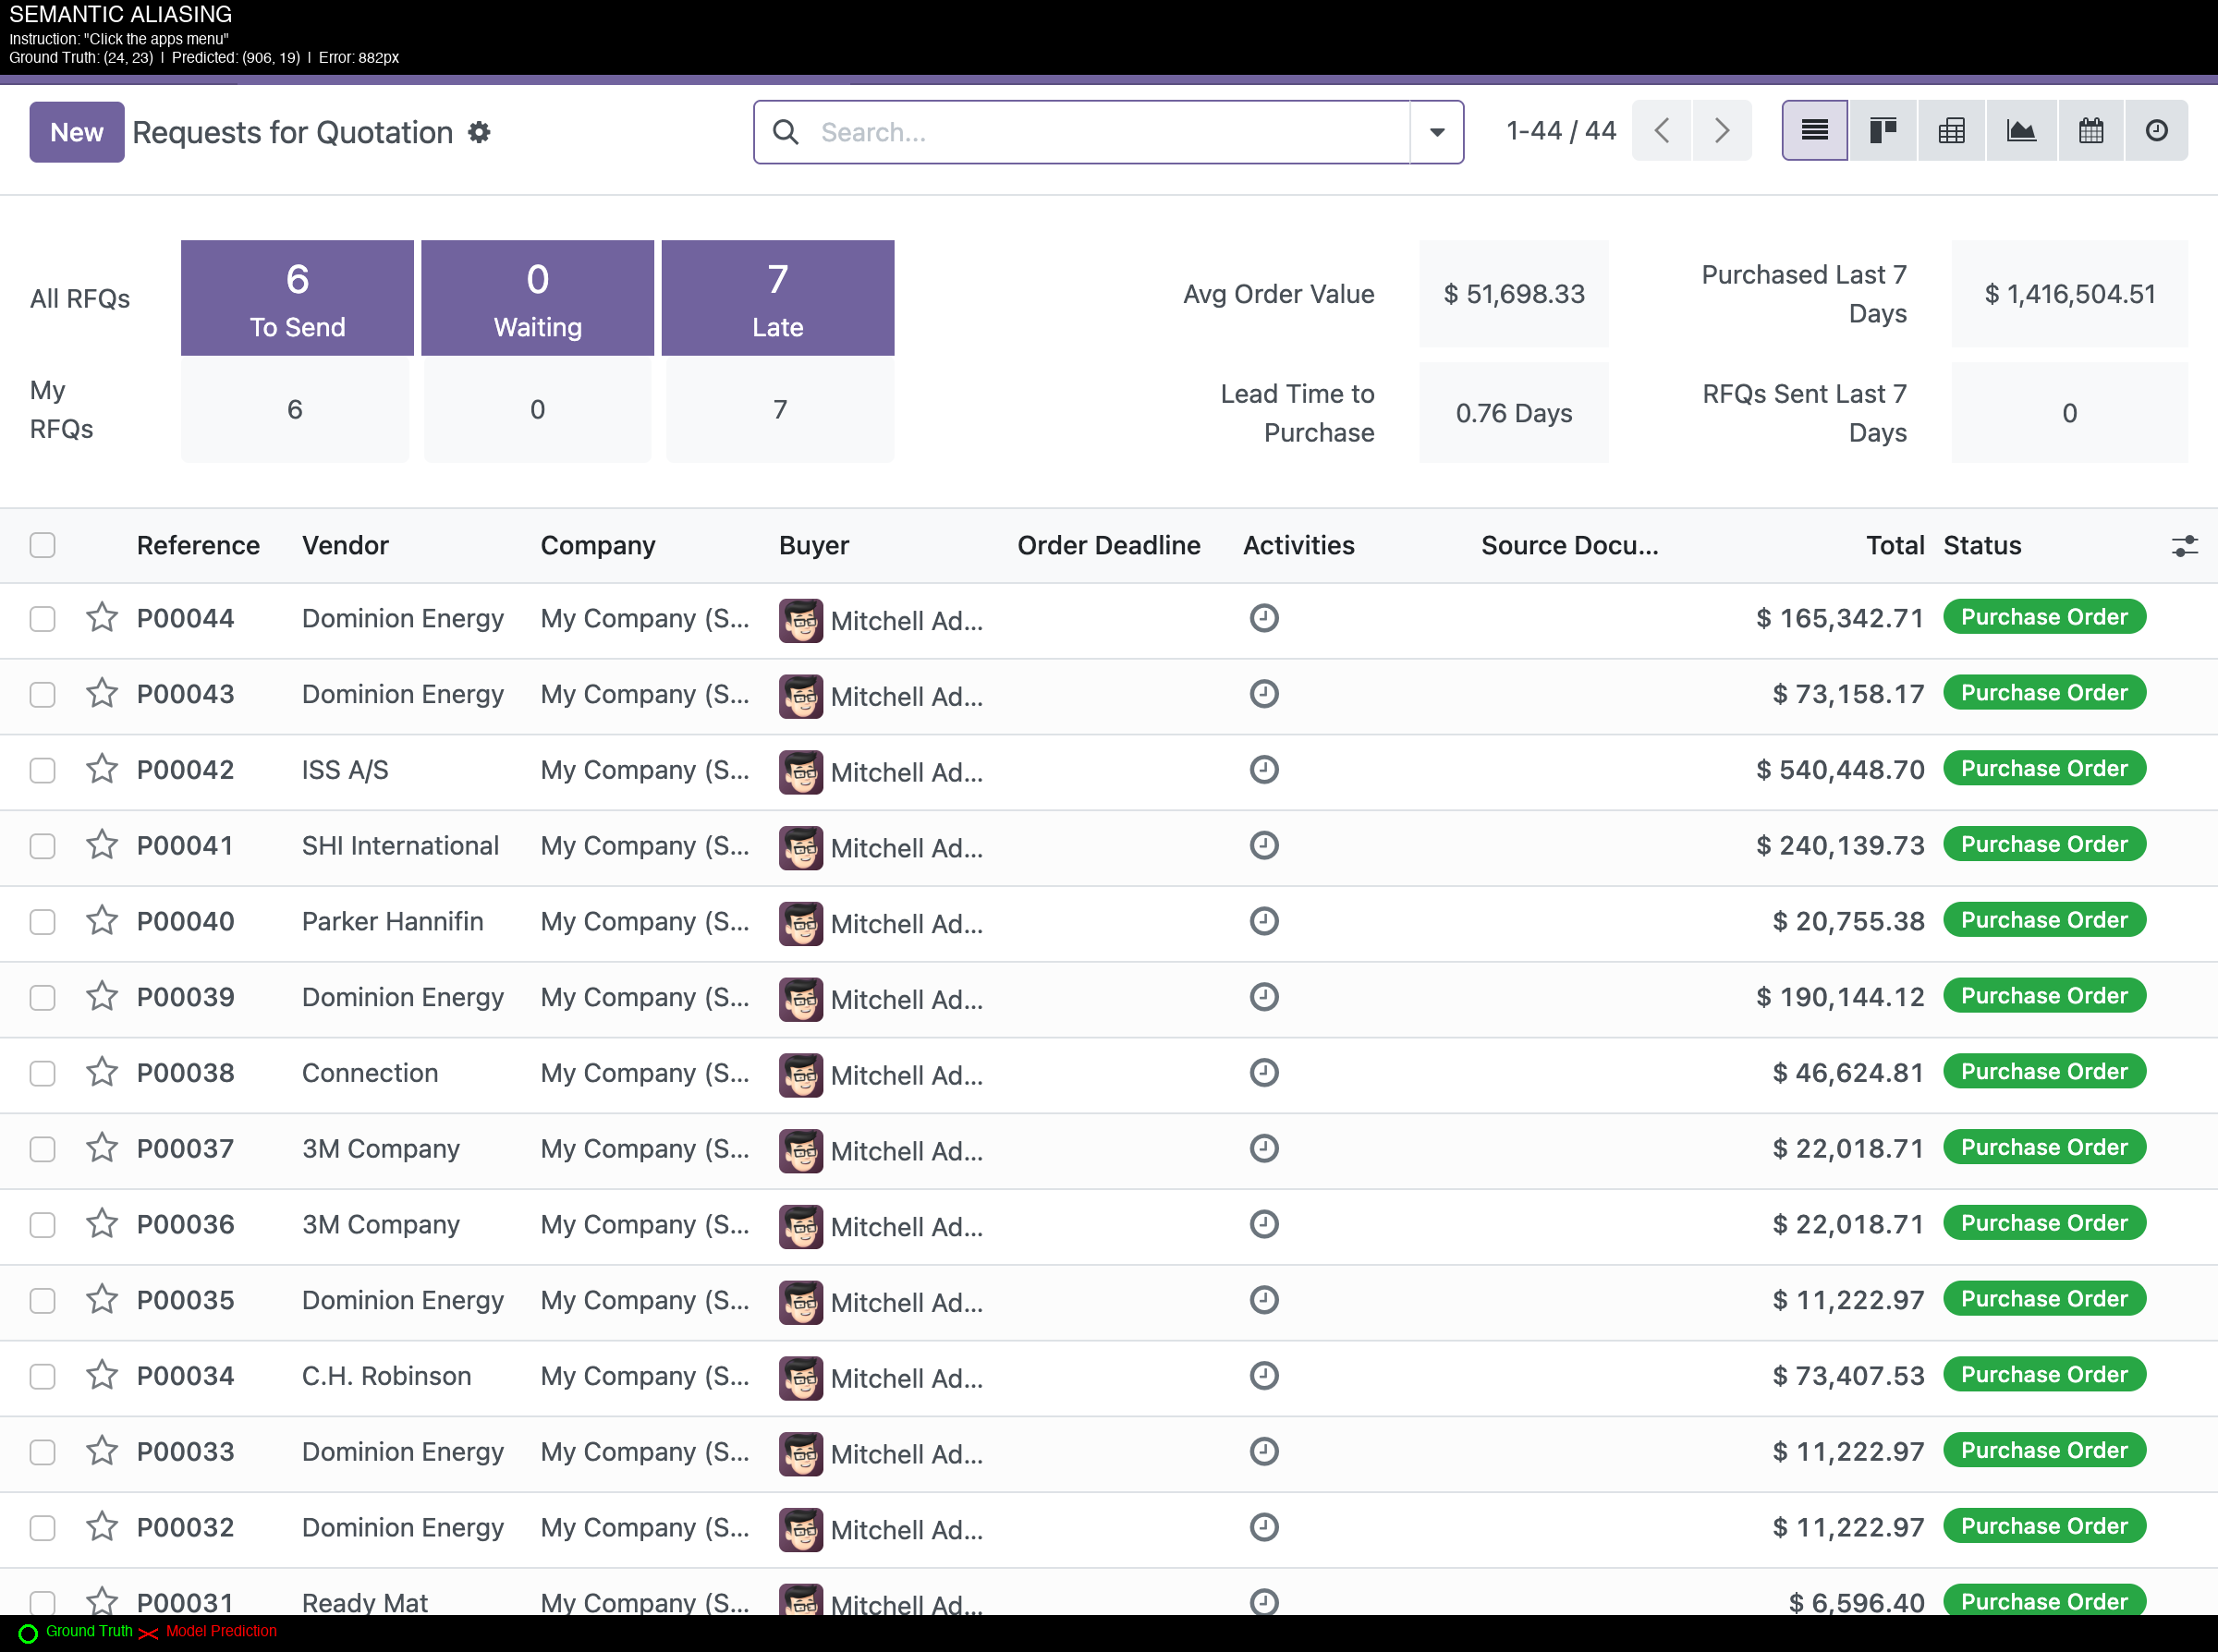
The following figures show example predictions on accounting UI. Green circles indicate ground truth locations; red X marks indicate model predictions.
Figure 1: Semantic Aliasing - "Click Confirm Order" (1006px error)Model predicted (1082, 125) instead of ground truth (76, 129). The prediction landed on "Purchase Order" button on the right instead of the target action button on the left.
Figure 2: Semantic Aliasing - "Click the apps menu" (882px error)Model predicted (906, 19) instead of ground truth (24, 23). The target was a small grid/apps icon (17x17px) in the top-left corner.
These examples illustrate the gap between benchmark performance and performance on enterprise software.
Element Density: A typical accounting form contains 20+ interactive elements in a 1920x1080 viewport, many sharing identical visual styling. This density may exceed what current training datasets represent.
Domain Vocabulary: Instructions like "Click the Due Date field" use accounting terminology that may be underrepresented in general GUI training data. Disambiguating among multiple date-related fields on an invoice form may require domain-specific training.
7.2 Ensemble Considerations
High SOTA agreement (89-94%) suggests ensemble approaches may have limited benefit. Both models fail on similar samples because:
Shared training distributions lack ERP exposure
Icon scale failures affect all VLM-based grounders equally
Semantic aliasing requires domain-specific disambiguation training
7.3 Platform Variance Implications
The 42pp accuracy range across platforms suggests:
Modern UI frameworks (OWL, React) provide cleaner grounding signals
Legacy interfaces (PHP) with inconsistent styling are harder to ground
Fine-tuning should prioritize lowest-performing platforms (ERPNext, Dolibarr)
8. Recommendations
8.1 For CUA Practitioners
Validate on target domain before vertical deployment. ScreenSpot-Pro performance may not predict accounting UI performance.
Evaluate on target domain before deployment. Run real GPU inference on your specific application.
Expect 37pp degradation when moving from consumer to enterprise applications.
Consider domain-specific fine-tuning for accounting automation use cases.
8.2 For Fine-Tuning Strategy
Failure Mode
%
Training Data Focus
Semantic Aliasing
42.8%
Similar labels, form field disambiguation
Icon Scale
33.7%
Small icons, toolbar buttons, dense menus
Coordinate Regression
23.4%
Near-miss cases, bounding box precision
Collect 500+ training pairs balanced across platforms and failure modes. Prioritize hard examples from ERPNext (3.7%) and Dolibarr (7.3%).
Output format verified: ShowUI outputs normalized [0,1] coordinates. Correct denormalization to pixel space was confirmed.
Inference validated: Manual inspection of predictions showed the model produces valid coordinate outputs, but they consistently land on incorrect elements.
Possible explanation: ShowUI was trained primarily on web/mobile UI. Accounting software's dense, small-element layouts may fall outside its effective training distribution. Others are welcome to reproduce and verify.
9.2 Sample Size
The consistency of results across 4 independent platforms suggests the pattern is real
The 37pp gap is large enough that sampling variance is unlikely to explain it
The full dataset is released for others to extend
595 valid targets across 65 screenshots is modest. Larger benchmarks would strengthen conclusions. However:
9.3 Odoo Data Quality
Odoo's higher accuracy is consistent with its modern OWL framework
The excluded samples were random (infrastructure failure, not selection bias)
Other platforms (QBO, ERPNext, Dolibarr) were unaffected
77 Odoo samples were excluded due to missing screenshots during Modal evaluation (file sync issue). This reduced Odoo from 164 to 87 samples. The 45.98% accuracy is based on valid samples only. Key points:
9.4 Distribution Shift vs. Benchmark Overfitting
One interpretation: models are overfit to ScreenSpot's distribution, not that accounting UI is "harder." This is better framed as distribution shift the training data for these models underrepresents enterprise software. This is expected given training datasets are scraped from consumer web/mobile apps. The finding is still actionable: if deploying to enterprise, evaluate on enterprise data.
Metric: Point-in-box accuracy (prediction inside ground truth bounding box)
10. Conclusion
This study evaluated visual grounding models on professional accounting software. The results show a performance gap: GroundNext-7B drops from 50.2% (ScreenSpot-Pro) to 13.28% (accounting UI), while ShowUI-2B drops from 7.7% to 0.15%.
Summary of Findings:
Metric
Value
Best Model Accuracy
13.28% (GroundNext-7B)
Worst Model Accuracy
0.15% (ShowUI-2B)
Domain Gap
37-75pp
SOTA Agreement
89-94%
Primary Failure Mode
Semantic Aliasing (42.8%)
Platform Range
3.70% - 45.98%
Current benchmarks primarily cover consumer applications.
Key Insight: The 42pp platform variance (Odoo 46% vs ERPNext 3.7%) suggests UI framework modernity significantly impacts grounding performance, providing a roadmap for prioritizing fine-tuning data collection.
Takeaway: Domain-specific evaluation and fine-tuning may be necessary for vertical enterprise applications. Benchmark performance on consumer applications may not generalize to enterprise software.
I'm building a computer-use agent against real enterprise UIs. Not an API wrapper—something that has to perceive interfaces, identify real elements, and act in a way a human can inspect and understand.